|
|
|
|
|
|
||||||||||||||||||||||||||||||||||||||||||||
|
This package has the following dependencies:
If you have already used JEG Z-Legend, the previous version of this package, you may want to read the recent changes
JEG Color Legend appends a color legend for the vertical dimension of image
waves and for traces displayed with color as f(z). Controls at the top of
the graph allow live adjustment of data range and color table. Everything
is balloon-helped, so To try out this package, create a demonstration image, then apply a color legend and experiment with adjusting the displayed data range. Since the demonstration wave is of integral type with a data dimension scaling, you can experiment with dimensional scaling of integer waves. You can change the displayed colors by setting the color table; you can even easily create and use your own user defined color index waves interchangeably with the built-in color tables. When done, you can delete the color wave if you desire. If you find this package useful, you might also want to take a look at JEG Scale-Bar for appending a "nice" scale-bar to a graph. Create a Demonstration ImageExecute the following lines to create an image wave to try out the JEG Color Legend package.
	Make/N=(100,100)/O/W ColorLegendTest
	ColorLegendTest = sin(p/3)*cos(p/2)*sin(q/4)*32768
	SetScale d, 0, 3e-9, "m", ColorLegendTest
	Display; AppendImage ColorLegendTest
	ModifyGraph width={Aspect,1}
Apply a Color LegendWith a graph containing an image file topmost, select the menu item Graph->Append to Graph->Color legend... and select the appropriate image from the pop-up (usually only one choice). Alternatively, execute:
JEG_AddColorLegend2Graph("ColorLegendTest")
It may be necessary to resize the window to see all of the controls. Adjusting the Displayed Data Range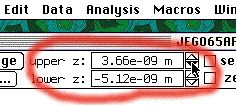
To change the upper and lower thresholds of the displayed image, either
type or click in the
At least for now, the units text is not available to JEG Color Legend and
will not be parsed if changed by the user, i.e., if you change "m" to "nm"
in the above window, the additional factor of 10-9 will be ignored. The
"proper" response would be rather easy to implement if the
Restoring the full data range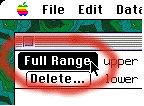
Click the " Offsetting a threshold to zero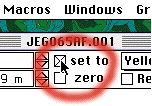
Click the " Dimensional Scaling of Integer Waves
As of version 2.0, JEG Color Legend uses a particular (peculiar?)
interpretation of data dimension scaling. Specifically, if the wave is of
integral type and the "
If the wave is of floating point type
If the wave is of integer type and this checkbox is deslected, no scaling will be applied and the dimension string will not appear. To force a dimension string to appear without scaling, set the "Data Properties" "min" to 0 and "max" to MAXINT (28, 216, or 232, as appropriate for the wave precision), set the units string as desired and check the "Apply dimension scaling" checkbox. At the moment, only the difference between max and min is considered; no attempt is made to offset the minimum (it's awkward and I don't need it; let me know if you do and I'll see). Setting the Color Table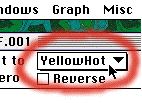
The color table of the image can be set with the color table menu. Both the image and its associated color legend are updated automatically. Click the "Reverse" check-box to reverse the color table or index wave. User defined color index wavesUser defined color index waves can be used transparently, along with the standard color tables: Grays, Rainbow, YellowHot, BlueHot, BlueRedGreen, and PlanetEarth. Any color index waves (see Image Plots[False Color Details]) placed in the data folder "root:Packages:'JEG Color Legend':'Color Index Waves':" will be appended to the end of the color table menu. To create a color index wave (appropriate, perhaps, for representing a phosphor screen image): NewDataFolder/O/S root:Packages NewDataFolder/O/S 'JEG Color Legend' NewDataFolder/O/S 'Color Index Waves' Make/N=(100,3)/W/U/O 'It ain´t easy bein´ green' 'It ain´t easy bein´ green'[][0] = 0 'It ain´t easy bein´ green'[][1] = 65535*p/100 'It ain´t easy bein´ green'[][2] = 0 Then, select the color table menu in an image file with appended Color Legend to try the new color index (you can create a demonstration image to test it on). Delete the Color Legend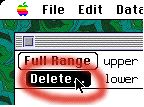
Clicking this button deletes the color legend. A dialog is presented which gives the (default) option of deleting the color legend controls as well. This may seem peculiar, but I've found that some images, such as diffraction patterns, don't need the legend itself, but benefit from controls for adjusting the color table and display thresholds.
This button kills everything in the Recent ChangesSince version 2.0 (JEG Z-Legend), the following items (in addition to the name) have changed:
Disclaimer:WaveMetrics is not responsible for the content of this site.Please contact me with any questions. You are the [an error occurred while processing this directive] visitor to this page.
Last modified August 5, 2003 2:30 PM
|
||||||||||||||||||||||||||||||||||||||||||||||||

