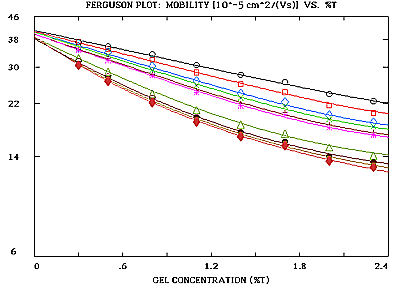
This semi-logarithmic plot was first published by Kenneth A. Ferguson, when he analyzed hormones of the pituitary gland in starch gels (Fig.3 and Equation 1 of article published in Metabolism 13, 985-1002 (1964)). Chrambach and Rodbard [Science 172, 440 (1971)] adopted for it the name Ferguson plot. Ferguson discussed the Origin of the Ferguson plot in Electrophoresis 28, 499-500 (2007).
Gel electrophoresis is usually performed at one single gel concentration. Migration distances of sample zones are compared with the position of standards to arrive at a determination of molecular size. This method is adequate for many applications. The procedure introduced here is not meant to replace routine procedures for examining hundreds of DNA our RNA samples per day.
Gel electrophoresis depends on both particle size and surface net charge density. Determining particle sizes in ONE gel will only work, if ALL samples and standards have the SAME surface charge. This is usually true for nucleic acids and SDS denatured proteins. If the surface charge of compared sample components and standards is not equal, the "single gel - one lane of standards method" can be compared to solving one equation (migration distance) with two unknowns (molecular size and charge).
In addition to variable charges on molecules, errors in size determination are also possible, if sample and standards are of different nature, i.e., vary in conformation. E.g., both linear and circular DNA or spherical and rod-shaped particles are investigated. In all these cases, Ferguson plot analysis may be beneficial, as it allows to distinguish different particle shapes, sizes and surface net charge densities. The phenomenon of atypical sample migration is called anomalous migration or peak inversion in the literature.
Please see also related information about the Ogston model.

Fig. 1: Capillary electrophoresis of DNA fragments in liquid agarose as published in Electrophoresis 13, 286-294 (1992). The plot was generated by program ElphoFit (plot size reduced).
The Ferguson plot will be linear or nonlinear depending on the problem at hand. The plot may be evaluated by program ElphoFit. It uses file input. The output consists of graphics and tables providing statistical information. Part of the output are the size and free mobility (mobility in the absence of a gel, related to surface net charge density) of unknown particles. The size is determined in terms of effective molecular radii. The program allows to convert these radii to values of molecular (or particle) weight in Dalton or base pairs (bp). Parameters descriptive of the gel matrix are also specified. The slope of linear Ferguson plots is proportional to particle size. The intercept on the ordinate specifies particle free mobility. Particles of similar size have parallel Ferguson plots. Particles with the same surface net charge density have the same intercept on the log(mobility) axis (ordinate). This way, charge and size isomers can easily be detected.
Non-spherical particles produce nonlinear Ferguson plots. Nonlinearity may also occur, if gel matrix parameters vary with gel concentration. The slope of nonlinear plots close to 0 gel concentration is related to particle size. Size estimates are usually pretty good, even if differently shaped Ferguson plots are compared that originate from particles of different conformation.
Summarizing: The Ferguson plot method is more laborious, but yields more information and is capable of detecting anomalies which would remain undetected on a SINGLE gel. Sharp bands on a single gel do not necessarily warrant correct results.
Further information and literature are provided in the Readme files of the ElphoFit software package. Please address suggestions and further questions to:
Dietmar Tietz, Email: djt@his.com